
Elegran Manhattan Market Update: May 2022
Overall Manhattan Market Update: May 2022

Manhattan Market Update
April is traditionally one of the busiest months of the year for Manhattan Real Estate and the month when supply typically peaks for the Spring market. This April, 1,410 contracts were signed, 6% fewer than last month and 12% fewer than April 2021. From a contract perspective, April marks the first month this year when contract activity has fallen behind pace compared to a year ago. Although by historical standards contract activity remains incredibly high, signs are forming that contract activity may be normalizing. In the face of rising interest rates, a possible recession, continued geopolitical instability and falling equity markets, future demand might be pulled forward to transact sooner. What effect this will have on the transaction volumes over the next six months remains to be seen. On the supply end, sellers have been coming to market to meet today’s demand, as nearly 2,200 new listings came to market in April, increasing supply by 12% compared to March. As supply has increased, the Market Pulse, a ratio of supply and demand, has decreased 1% compared to last month and the median listings discount increased from 3.6% in March to 4% in April, raising the question of whether the seller’s leverage has peaked. Homes are entering contract quicker, 71 days on median, a decrease of 7% from last month and 37% from last year. Prices have also increased, with the median sales price rising 6% compared to last month and 11% compared to last year to $1.25M and the median price per square foot increasing half a percent compared to last month and over 10% compared to last year to $1,435.
Manhattan Supply
Total supply increased in April as expected with nearly 2,200 new listings coming to market, increasing total supply by 12% to 6,206 units available for sale. Supply is now above 6,000 units for the first time since November 2021. While still at historically above-average levels, supply remains lower than 2018, 2019 and 2021 and feels even lower because of the above-average level of demand. Furthermore, April is traditionally the peak of supply in the spring market, as new-to-market supply begins to wane in May approaching the summer season. This year, a historically high-amount of inventory also came to market in April, second to only April 2021. Again, overall supply is kept in check because of the continued strong buyer demand, which is turning the inventory over quickly. Compared to last April, supply is nearly 14% lower this year.
Note: “Total Supply” refers to the amount of inventory on the market at a given time. “New Supply” or “New-to-Market” refers to the amount of new inventory that came on the market in a specific time period.

INVENTORY: Key Takeaways
- Compared to last year there is less inventory across all price ranges, neighborhoods and apartment sizes.
- Compared to last month, inventory increased across all market segments.
- In the last month, inventory increased the most on a percentage basis in Downtown.
- In the last month, inventory increased the least on a percentage basis for Studios.

Manhattan Buyer Activity as measured by signed contracts, remained historically very high for the month of April, as 1,410 contracts signed, which is 6% less than in March and 12% lower than April 2021. This marks two years in a row with contract activity well above average, and has been a key reason why supply has been trending lower, despite above-average levels of new-to-market supply.

CONTRACT ACTIVITY: Key Takeaways
- Compared to last month, contract activity decreased across all price ranges, neighborhoods and apartment sizes except for the $10M+ price range, studios and 2-bedrooms.
- In the last month, apartments priced between $1–2M had the largest percentage decrease in contract activity.
- In the last year contract activity decreased across all market segments.
- In the last month, on a percentage basis, contract activity increased the most for studio apartments.

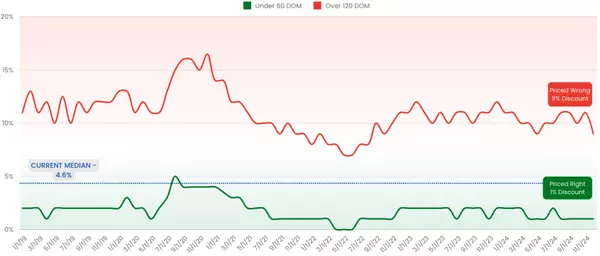
Manhattan’s Market Pulse [a ratio between pending sales and supply] decreased by 1% in April as supply increased at a slightly faster rate than pending sales increased. The current Market Pulse is 0.76, still indicative of a seller’s market, and is 15% higher than a year ago. With the slight drop in the Market Pulse, the median listing discount has increased and currently stands at 4% on the median, an increase of 11% from last month and a decrease of 50% from last year.
A Market Pulse below 0.4 is considered a buyer’s market, a Market Pulse between 0.4 and 0.6 is considered a neutral market and a Market Pulse above 0.6 is considered a seller’s market.] In a seller’s market, sellers often have more leverage than buyers because demand is greater than supply, resulting in apartments selling quickly, fewer discounts and increased bidding wars.

MARKET PULSE: Key Takeaways
- In the last month, the Market Pulse increased for homes priced under $1M and decreased for those priced above $1M.
- Over the last year, the Market Pulse increased across all price ranges, neighborhoods and bedroom counts, except for Upper Manhattan.
- The Market Pulse is now the highest for apartments priced $600K-$1M.
- The Market Pulse increased noticeably in the last month for studio apartments, while decreased substantially for 3+ bedroom homes.
- The Upper West Side is the neighborhood with the highest Market Pulse followed by Downtown, while Upper Manhattan continued to have the lowest.

Pricing & Discounts
The Median Sales Price across Manhattan for the month of April was $1,253,750, an increase of nearly 6% compared to March and an increase of 11% compared to last year. On a price per square foot (PPSF) basis, the Median PPSF is $1,435, an increase of 1% from the previous month and an increase of 10% compared to last year. The continued strength of the luxury market is one reason why the price increases are as high as they are, however, leading indicators hint that the luxury market resurgence may be running its course. The market may be seeing a short-term peak of prices as the market reassesses the current rising interest rate environment, geopolitical situations and choppy equity markets. Regardless of prices, the market still feels very competitive for buyers, which is resulting in homes continuing to sell quickly. The median listing discount is currently 4% with nearly 15% of homes having sold over the asking price in Q1 2022.
PRICING: Key Takeaways
- Over the last year, the median sales price for condos rose double digits in all neighborhoods except for Upper Manhattan, which decreased by 4%.
- Over the last year, the median sales price for coops decreased in all neighborhoods, except for the Upper East Side which increased by 28%.
- Over the last year, the median price per square foot increased across all market segments except for those priced $5M+.


MEDIAN LISTING DISCOUNT: Key Takeaways
- The median listing discount increased for condos, coops and townhouses in the last month, and remains lower compared to last year.
- The median listing discount decreased for homes priced between $600K-$1M and for $5–10M, and increased for the other price ranges in the last month.
- In the last month, the median listing discount increased for all neighborhoods, except for Downtown.
- In the last year, the median listing discount decreased across all market segments.


What this means for…
Buyers:
- Buyers continue to face pressure from multiple bidders and rising interest rates, but have a slight reprieve as supply increases.
- Some buyers are accelerating their plans to purchase sooner, given, in part, rising interest rates.
- Ample new supply is coming on the market this spring, offering new options for buyers, and buyers need to be ready to compete with other ready-to-transact buyers.
- The median sales price and median price per square foot are continuing to increase.
- Given rising rents and current inflation, buying may make more sense than renting today (with a holding period of 3–5 [or more] years).
Sellers:
- Seller competition is increasing as supply increased 12% in April.
- The median listing discount increased from 3.6% in March to 4% in April, one indicator of a possible peak to the seller’s market.
- Sellers need to read the market cues and readjust quickly if they are overpriced or mispositioned in the market.
- Heading into the summer market, sellers who want to sell should strongly consider listing sooner than later to take advantage of the current market conditions.
Renters:
- Covid-era rent discounts are a thing of the past, as renters experience rapid price increases which are erasing prior discounts and landlord concessions.
- Rents are now back in-line with the increasing trend of the last 5-years.
- Competition remains fierce amongst tenants, with apartments often receiving multiple offers and frequently going to bidding wars.
- Supply continues to trend downward heading into the spring and summer rental market as tenants may choose to renew rather than compete in the rental market and move.
Investors:
- Rising interest rates should have a more muted effect in Manhattan, as Manhattan is less leveraged than most of America, enabling the NYC market to withstand the pressures of ascending interest rates better than many other national markets.
- Leveraged investors who have a lower interest rate locked in stand to benefit from the inflationary pressures and rising rental rates. Those investors should continue to hold and experience rising cap rates in the years to come.
Please contact us if you would like to learn more …
Recent Posts


Stay in the Know!
Sign up to receive our monthly newsletter

