
Elegran Manhattan Market Update: March 2025

Overall Manhattan Market Update: MARCH 2025
A Seller’s Market—But Only for the Right Properties
Manhattan’s real estate market is punishingly efficient, where although strong fundamentals suggest an advantage for sellers, only those who execute with precision are seeing success. Turnkey, well-priced, and highly desirable properties move quickly, while those that fall short in presentation, condition, or pricing struggle to gain traction.
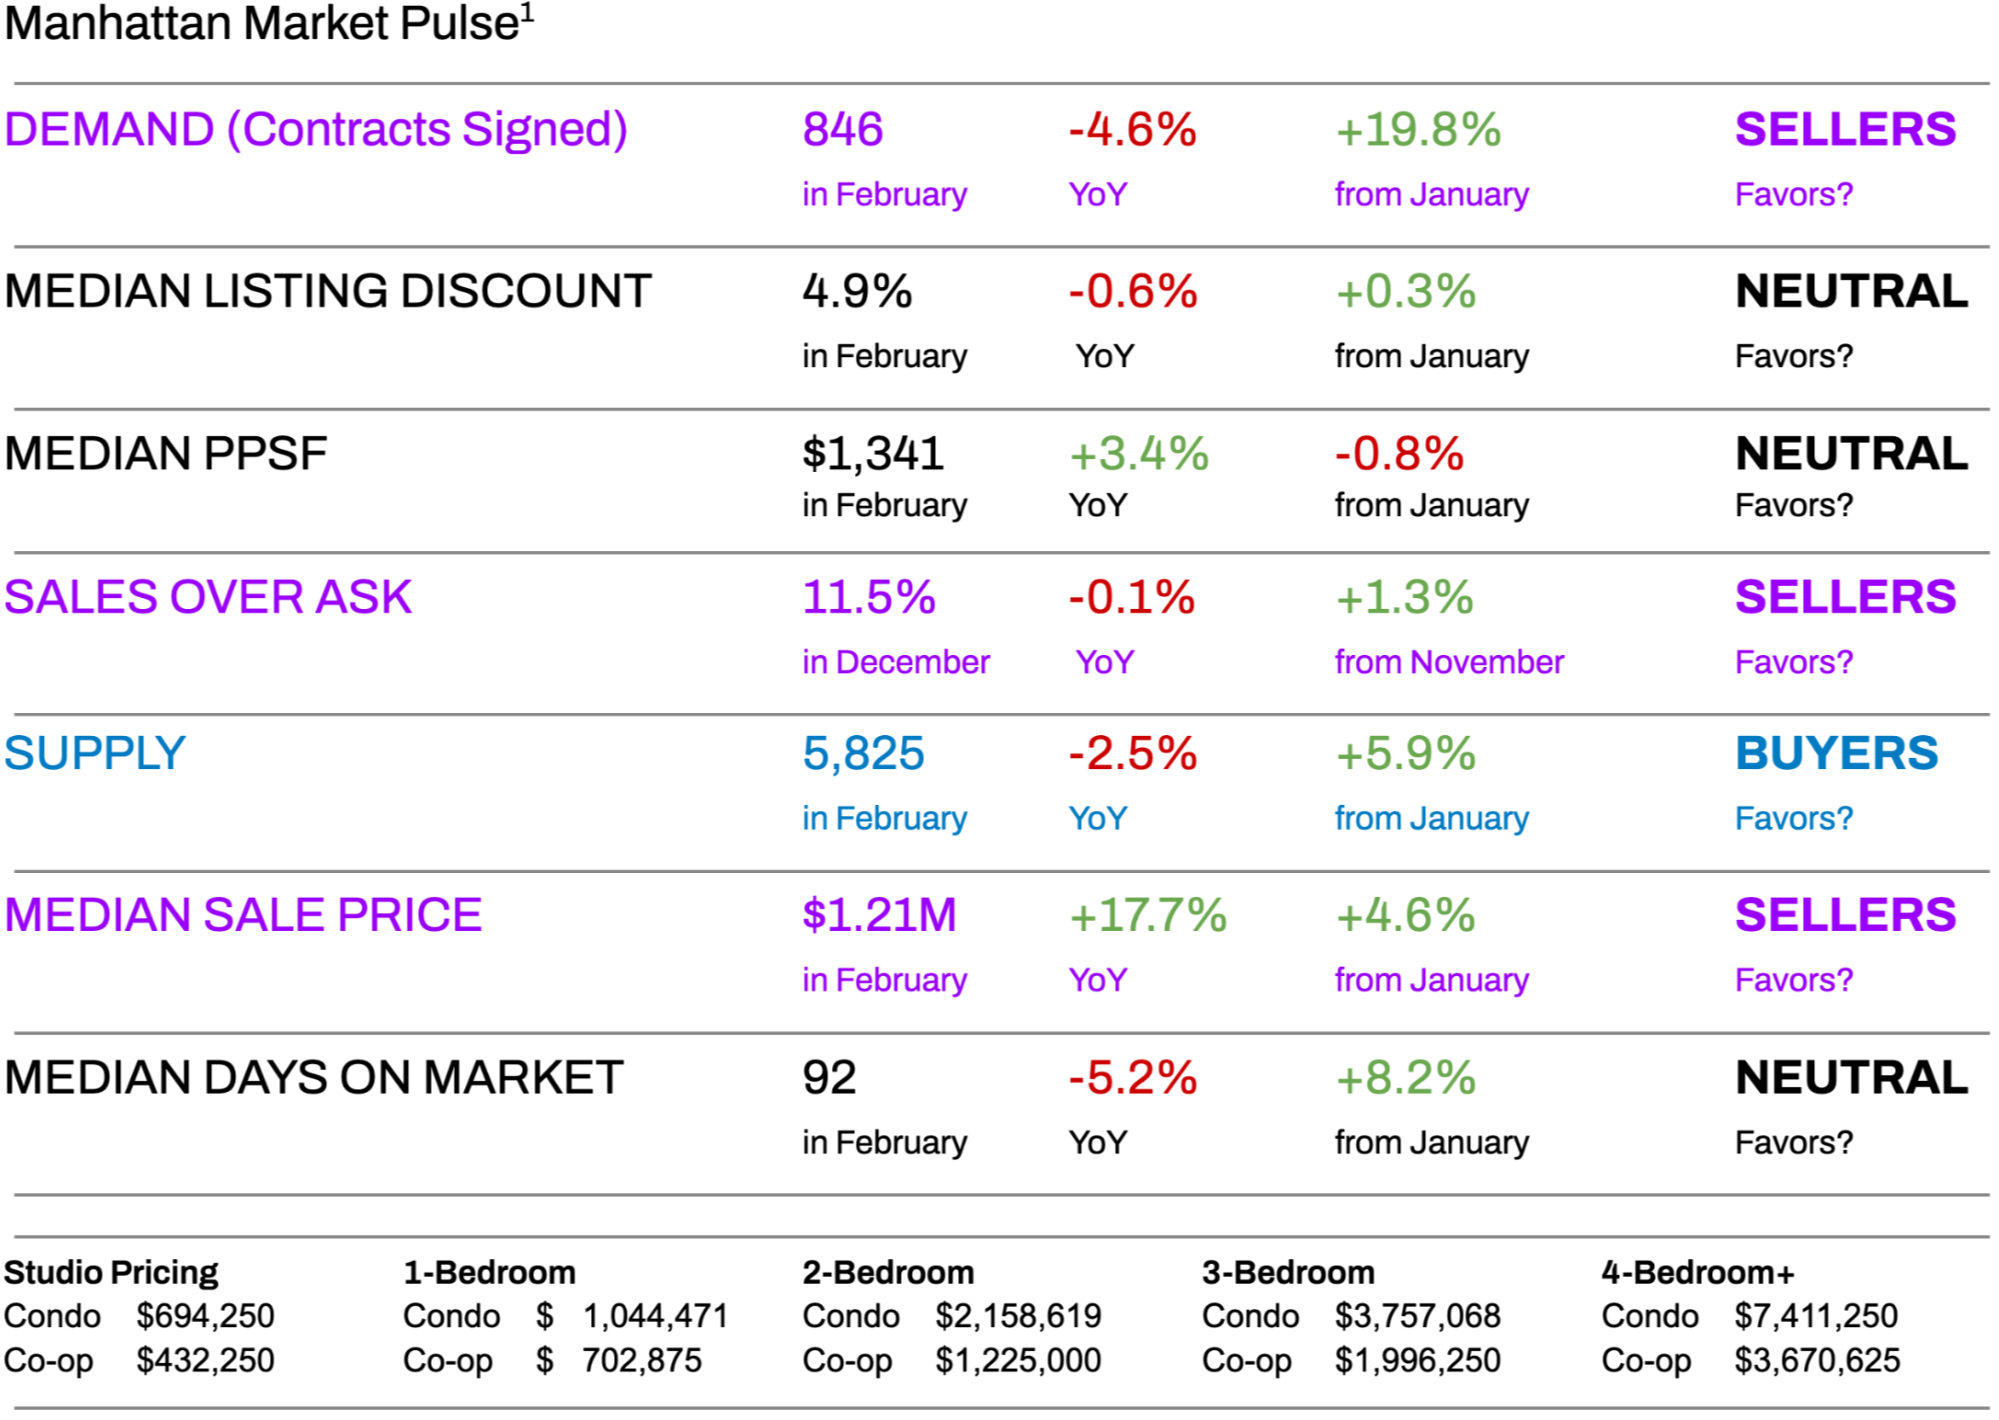
February data underscores this selective market dynamic. Inventory rose 5% month-over-month to 5,825 listings but remains 2.5% lower than last year, reinforcing ongoing supply constraints. Contract activity increased 20% from January, in line with seasonal trends, yet remains 4.6% lower than February 2024, suggesting that some demand was pulled forward late last year when contract volumes exceeded expectations. Meanwhile, the median price per square foot dipped slightly (-0.8%) to $1,341, but remains 3.4% higher year-over-year, indicating long-term price stability. The median listing discount increased to 4.9% (+0.3% MoM), offering buyers slightly more room to negotiate. Yet, discounts remain lower than a year ago (-0.6%), signaling a market where pricing is increasingly aligned.
With mortgage rates hovering around 6.75% and expected to hold near 6.5% for the year, buyer demand remains steady but highly selective. Today’s buyers scrutinize every detail, favoring move-in-ready properties and rejecting homes that fail to meet high standards. Sellers who price accurately, invest in professional staging, and ensure their properties stand out are seeing competitive bidding, while others are left waiting.
For buyers, the slight increase in listing discounts provides a short-term window of opportunity before spring competition heats up. However, the year-over-year price increase of 3.4% confirms an upward trajectory, meaning those waiting for deep discounts are unlikely to find them. Sellers, meanwhile, must remain strategic. While supply remains tight, success is not guaranteed—only well-positioned, competitively priced homes are seeing multiple offers. With listing discounts still under 5%, the market remains resilient, favoring those who navigate it effectively.
Looking ahead, Manhattan appears poised to break out of its period of price stagnation and push through the eight-year price ceiling last set in 2016. With steady demand and constrained supply, upward price pressure is building—just as other once-hot markets, particularly in Florida and the West, are beginning to see price corrections after years of rapid appreciation. In contrast, Manhattan’s relative undervaluation over the past decade positions it as a market with growth potential.
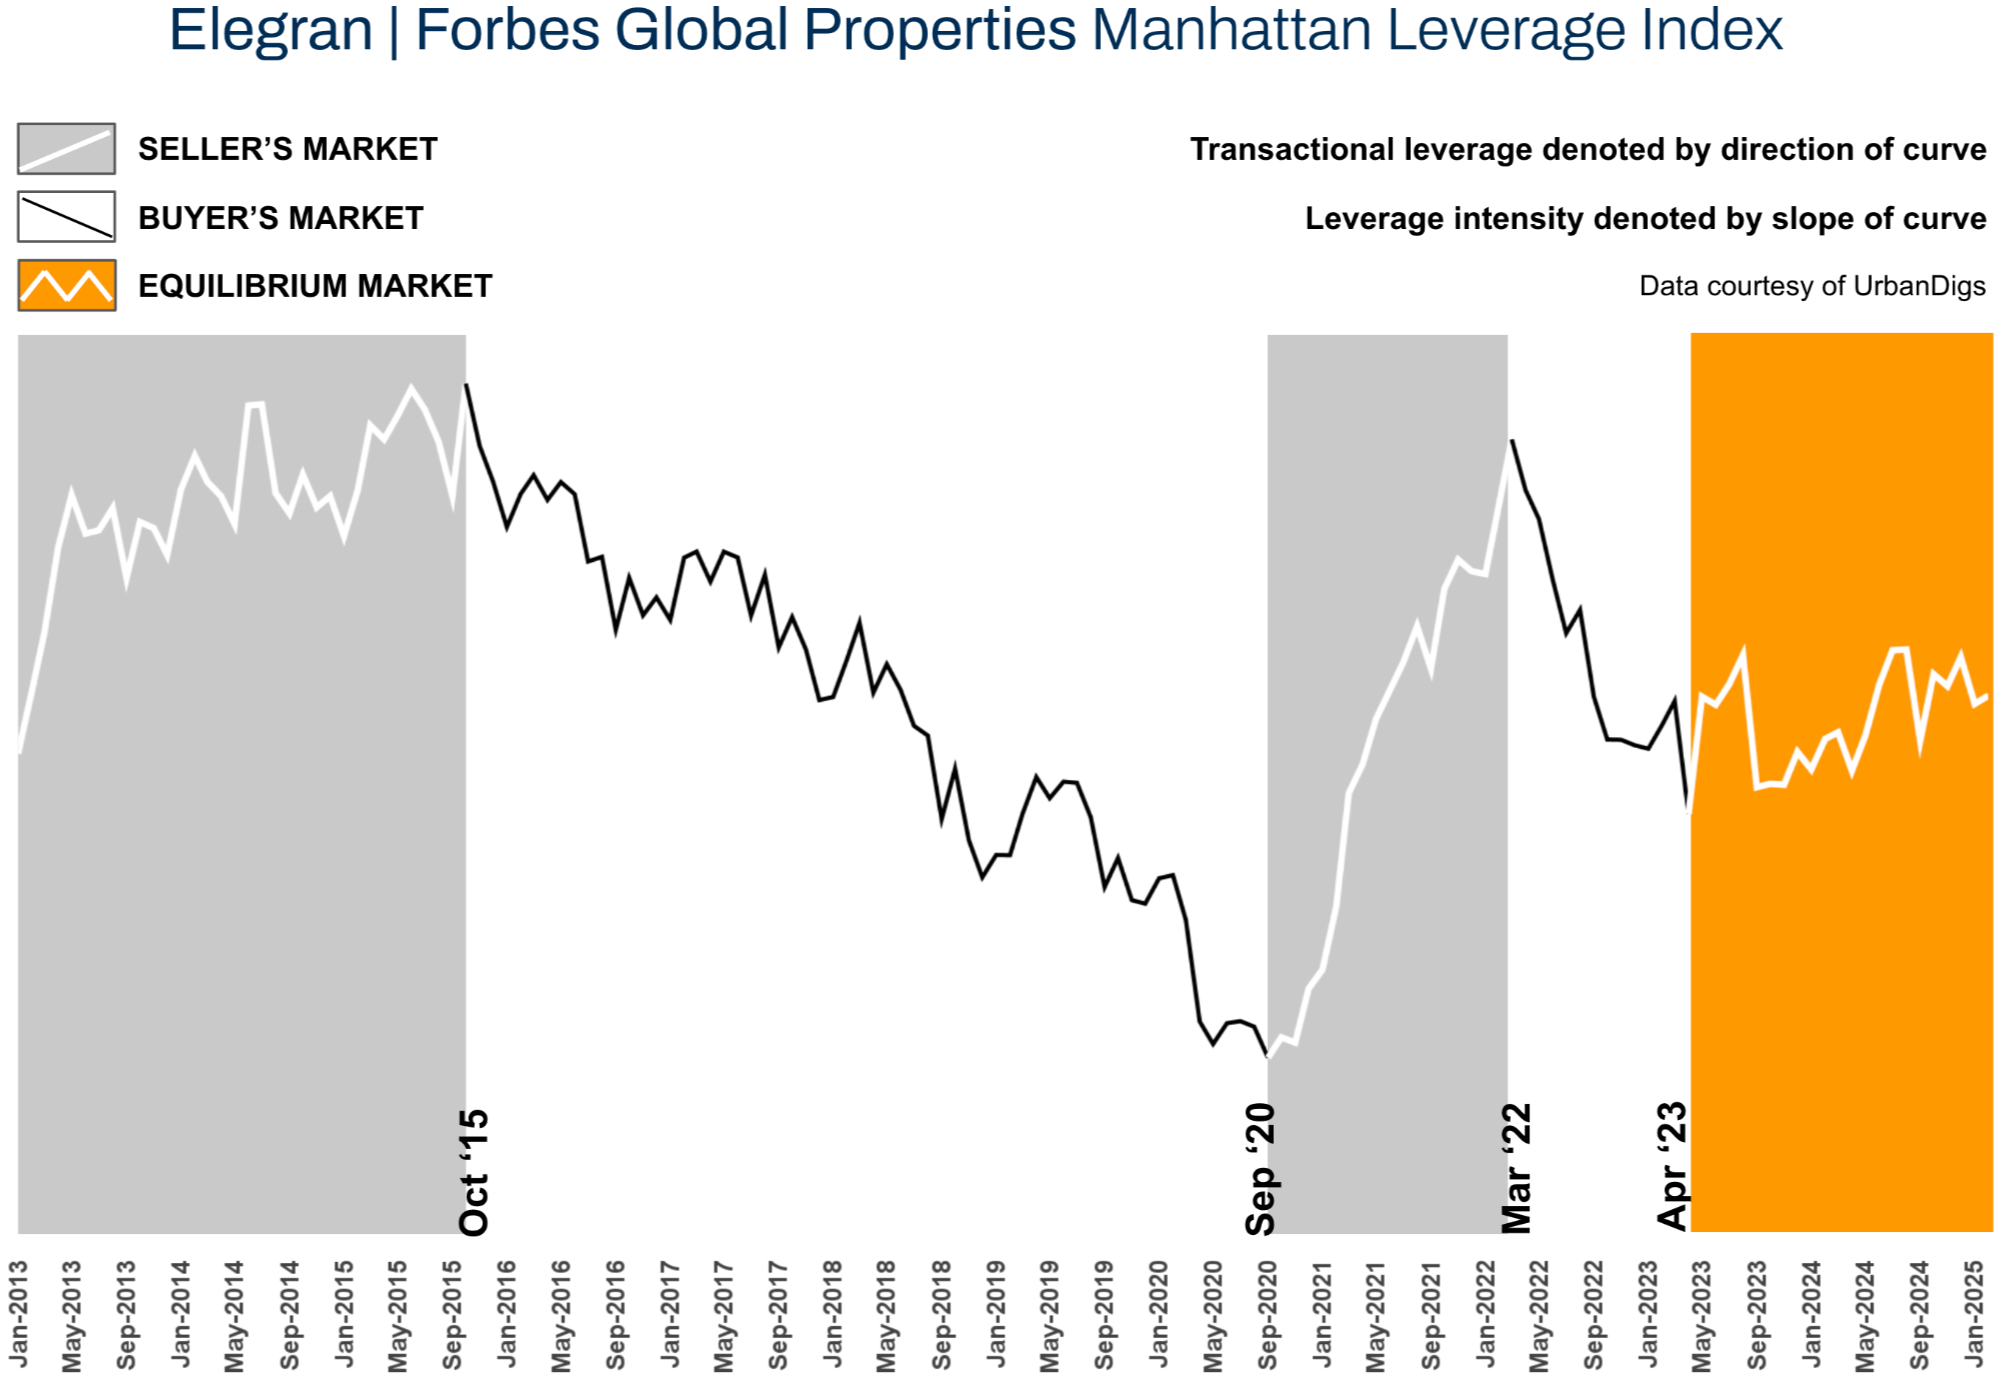
Elegran | Forbes Global Properties Manhattan Leverage Index
The Elegran | Forbes Global Properties Manhattan Leverage Index² is powered by four indicators: supply, demand, median price per square foot (PPSF), and median listing discount.
It informs us whether the current is a buyer’s or a seller’s market, i.e., which party possesses transactional leverage. Looking at the graph below, this is indicated by the direction of the curve, where:
- An increasing trend from left to right indicates a seller’s market
- A decreasing trend from left to right indicates a buyer’s market
Our indicator also informs us regarding the relative strength of that leverage, indicated by the slope of the curve, where:
- A gentle slope indicates a weak advantage by one party over the other
- A sharp slope indicates a strong advantage
It’s not just the numbers that matter—it’s the trajectory of the trend. Over the past two years, Manhattan’s residential real estate market has been shaped by shifting leverage between buyers and sellers. In the final quarter of 2024, sellers held a slight edge, only for buyers to regain control in January. Now, February has once again tipped the scales slightly in favor of sellers.
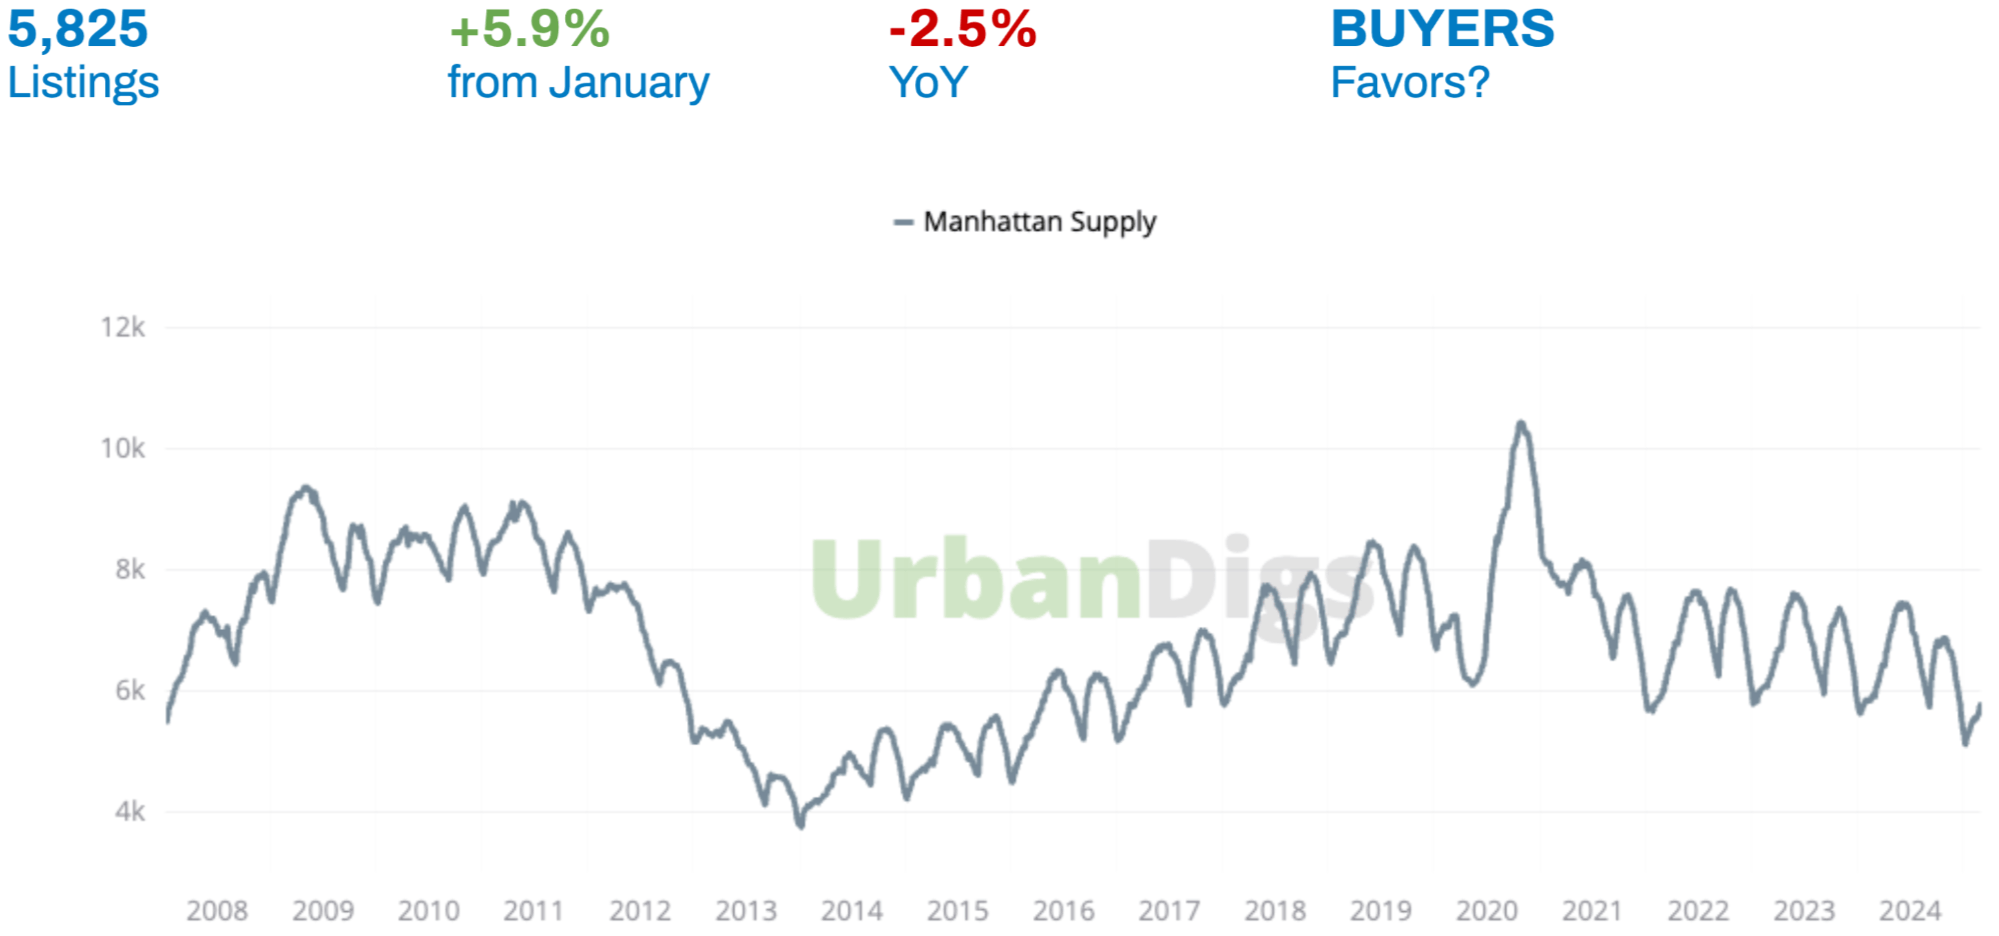
Manhattan Supply
Data & charts courtesy of UrbanDigs
Manhattan’s residential real estate market saw 273 new listings in February, a 5% month-over-month increase, bringing the total inventory to 5,825 properties for sale. This uptick aligns with typical seasonal trends as sellers begin positioning their properties ahead of the traditionally busy spring market.
Yet, despite this short-term gain, inventory remains 2.5% lower than in February 2024, reinforcing the persistent supply constraints that continue to shape market dynamics. With steady buyer demand, the result is a punishingly efficient market in which well-positioned, high-quality homes draw multiple offers while mispriced, mispositioned, or less desirable properties struggle to gain traction.
What this means for:
- BUYERS: More inventory means more choices, but with supply still below last year’s levels and buyer activity ramping up, competition for prime properties remains intense. Expect multiple offer scenarios for well-priced, move-in-ready homes.
- SELLERS: While increasing inventory typically favors buyers, the persistent year-over-year supply deficit supports price stability. Sellers with well-maintained, professionally staged, and competitively priced homes continue to hold an advantage. As spring listings grow, high-quality photography, strategic staging, impeccable marketing, and pricing precision will be key to standing out.
Expect inventory to continue its seasonal rise in March, though likely remaining below historical norms. With supply still constrained and demand holding firm, the market should maintain a balanced but competitive dynamic heading into spring.
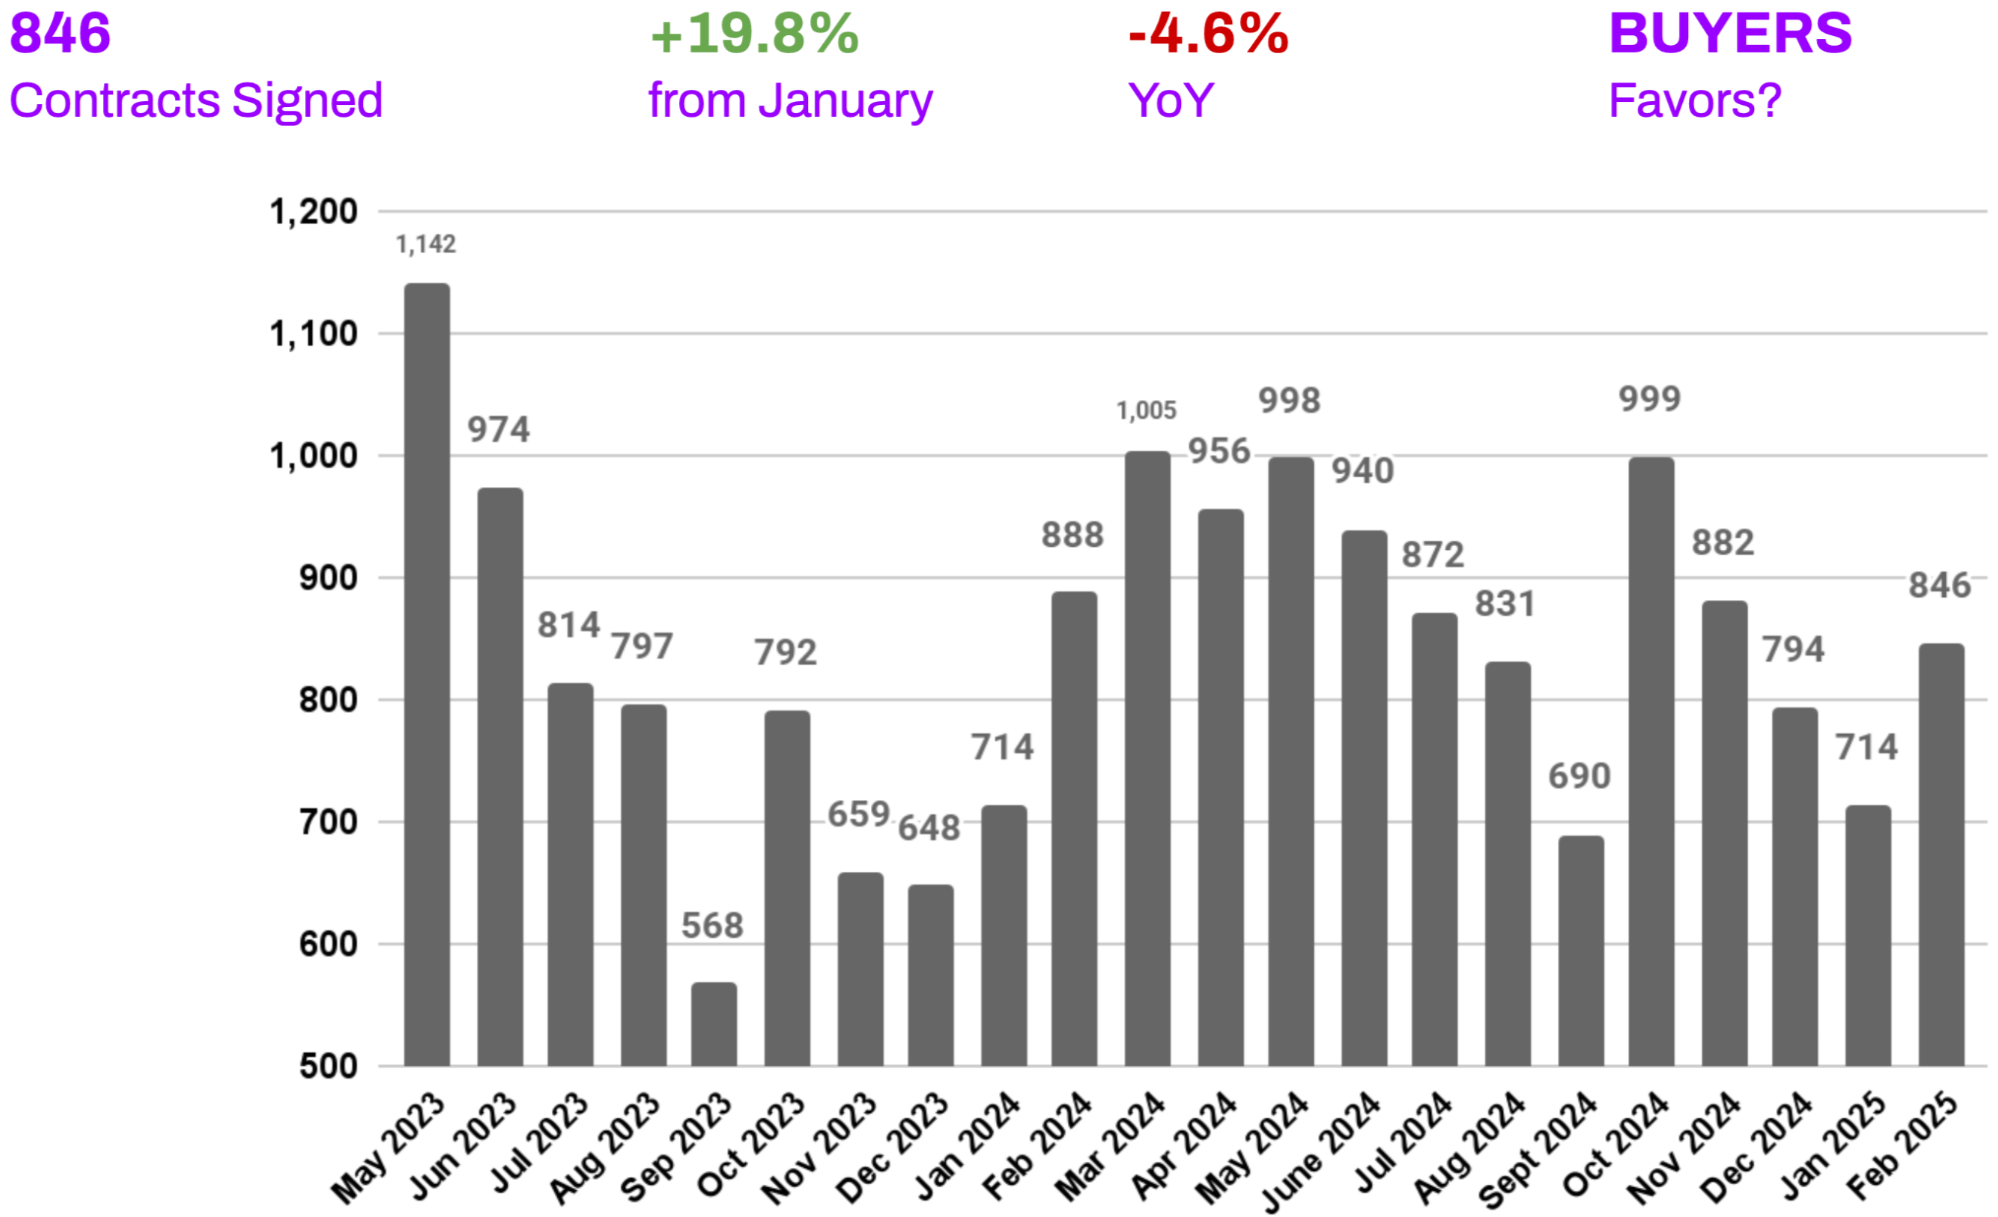
Manhattan Demand
Data courtesy of UrbanDigs
February followed historical trends with a nearly 20% month-over-month increase in contract signings, a typical seasonal uptick from January. However, contract activity remains 4.6% lower than in February 2024, and overall contract volume has remained relatively stable over the last four months.
While November and December saw above-average contract activity, January and February have been closer to historical norms. The key question is whether contract volumes will accelerate into spring or if some demand was pulled forward to late 2024. February’s contract volume landed squarely in the middle of the past decade’s February performance.
What this means for:
- BUYERS: The strong month-over-month growth in contract signings signals that early spring buyers are gaining momentum—those who act now can get ahead of rising competition. The year-over-year decline presents a temporary opportunity for well-prepared buyers who can move quickly on desirable properties before demand peaks. Having pre-approval in hand and clear priorities set will be key to securing a property in this evolving market.
- SELLERS: The significant monthly increase in contracts points to building momentum and rising buyer engagement, both of which should strengthen further into spring. While contract volume is slightly below last year’s levels, the trend is moving upward, reinforcing the importance of realistic pricing and strategic positioning. Sellers listing in March stand to benefit from strengthening demand and an increasingly active market.
Looking ahead, contract activity should climb further in March and April as the spring market gains momentum. However, whether volumes surpass last year’s levels remains uncertain. With mortgage rates currently around 6.75% and expected to hover near 6.5% throughout 2025, buyers have adjusted their expectations. Instead of waiting for rates to drop, transactions are increasingly necessity-driven—motivated by life events rather than market speculation.
Manhattan Median PPSF
Data & chart courtesy of UrbanDigs
Manhattan’s median price per square foot (PPSF) edged down 0.8% month-over-month to $1,341 in February. However, despite this slight dip, prices have climbed 3.4% year-over-year, signaling a broader upward trend.
As we move into March and the stronger spring market, expect month-over-month price increases to resume. Manhattan is showing signs of breaking out of its prolonged price stagnation, pushing upwards on the eight-year price ceiling set in 2016.
What this means for:
- BUYERS: The slight February dip could offer a brief window of opportunity before spring market conditions drive prices higher. However, the 3.4% year-over-year gain underscores that the long-term trend remains upward. Buyers should not expect deep discounts, especially on well-located, high-quality properties. This moment may represent a temporary plateau before demand-driven price increases take hold.
- SELLERS: While the monthly decline might raise concerns, the strong annual growth confirms market resilience. This trend highlights ongoing price appreciation, particularly for well-positioned properties in prime locations. Sellers should focus on the stronger year-over-year growth, as it indicates Manhattan real estate is steadily regaining value.
With inventory still below last year’s levels and seasonal demand increasing, PPSF is likely to resume its upward trajectory in March and April. Manhattan appears poised to break through its long-standing price ceiling, reinforcing its status as a blue-chip real estate market where long-term value appreciation remains a key driver.
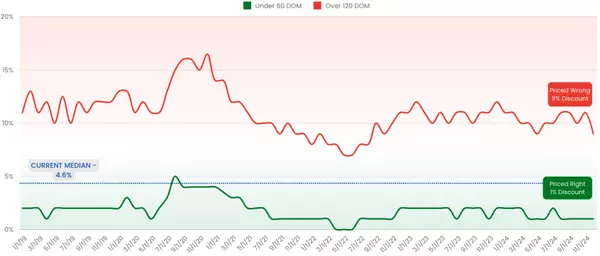
Manhattan Median Listing Discount

Data courtesy of UrbanDigs
The median listing discount for Manhattan residential apartments inched up 0.3% to 4.9% in February, offering buyers slightly more negotiating leverage heading into the spring listing season. However, the year-over-year trend tells a different story—listing discounts are 0.6% lower than in February 2024, signaling greater pricing alignment and sustained market stability.
What this means for:
- BUYERS: The modest increase in discounts provides slightly more room for negotiation, particularly for properties that have been on the market for 60+ days or have undergone price reductions. While this offers select opportunities, the overall market remains punishingly efficient, meaning well-priced, high-quality properties still attract strong competition.
- SELLERS: Despite the small month-over-month increase in discounts, the tightening year-over-year spread confirms that sellers hold a stronger position than in early 2024. This highlights the importance of accurate initial pricing—overpricing leads to extended days on market and potential price cuts, which today’s data-driven buyers quickly recognize and exploit.
With discounts under 5%, the market reflects a balanced but strengthening seller environment. As spring demand picks up and inventory remains constrained, expect continued price integrity and stable transaction volume in the months ahead.
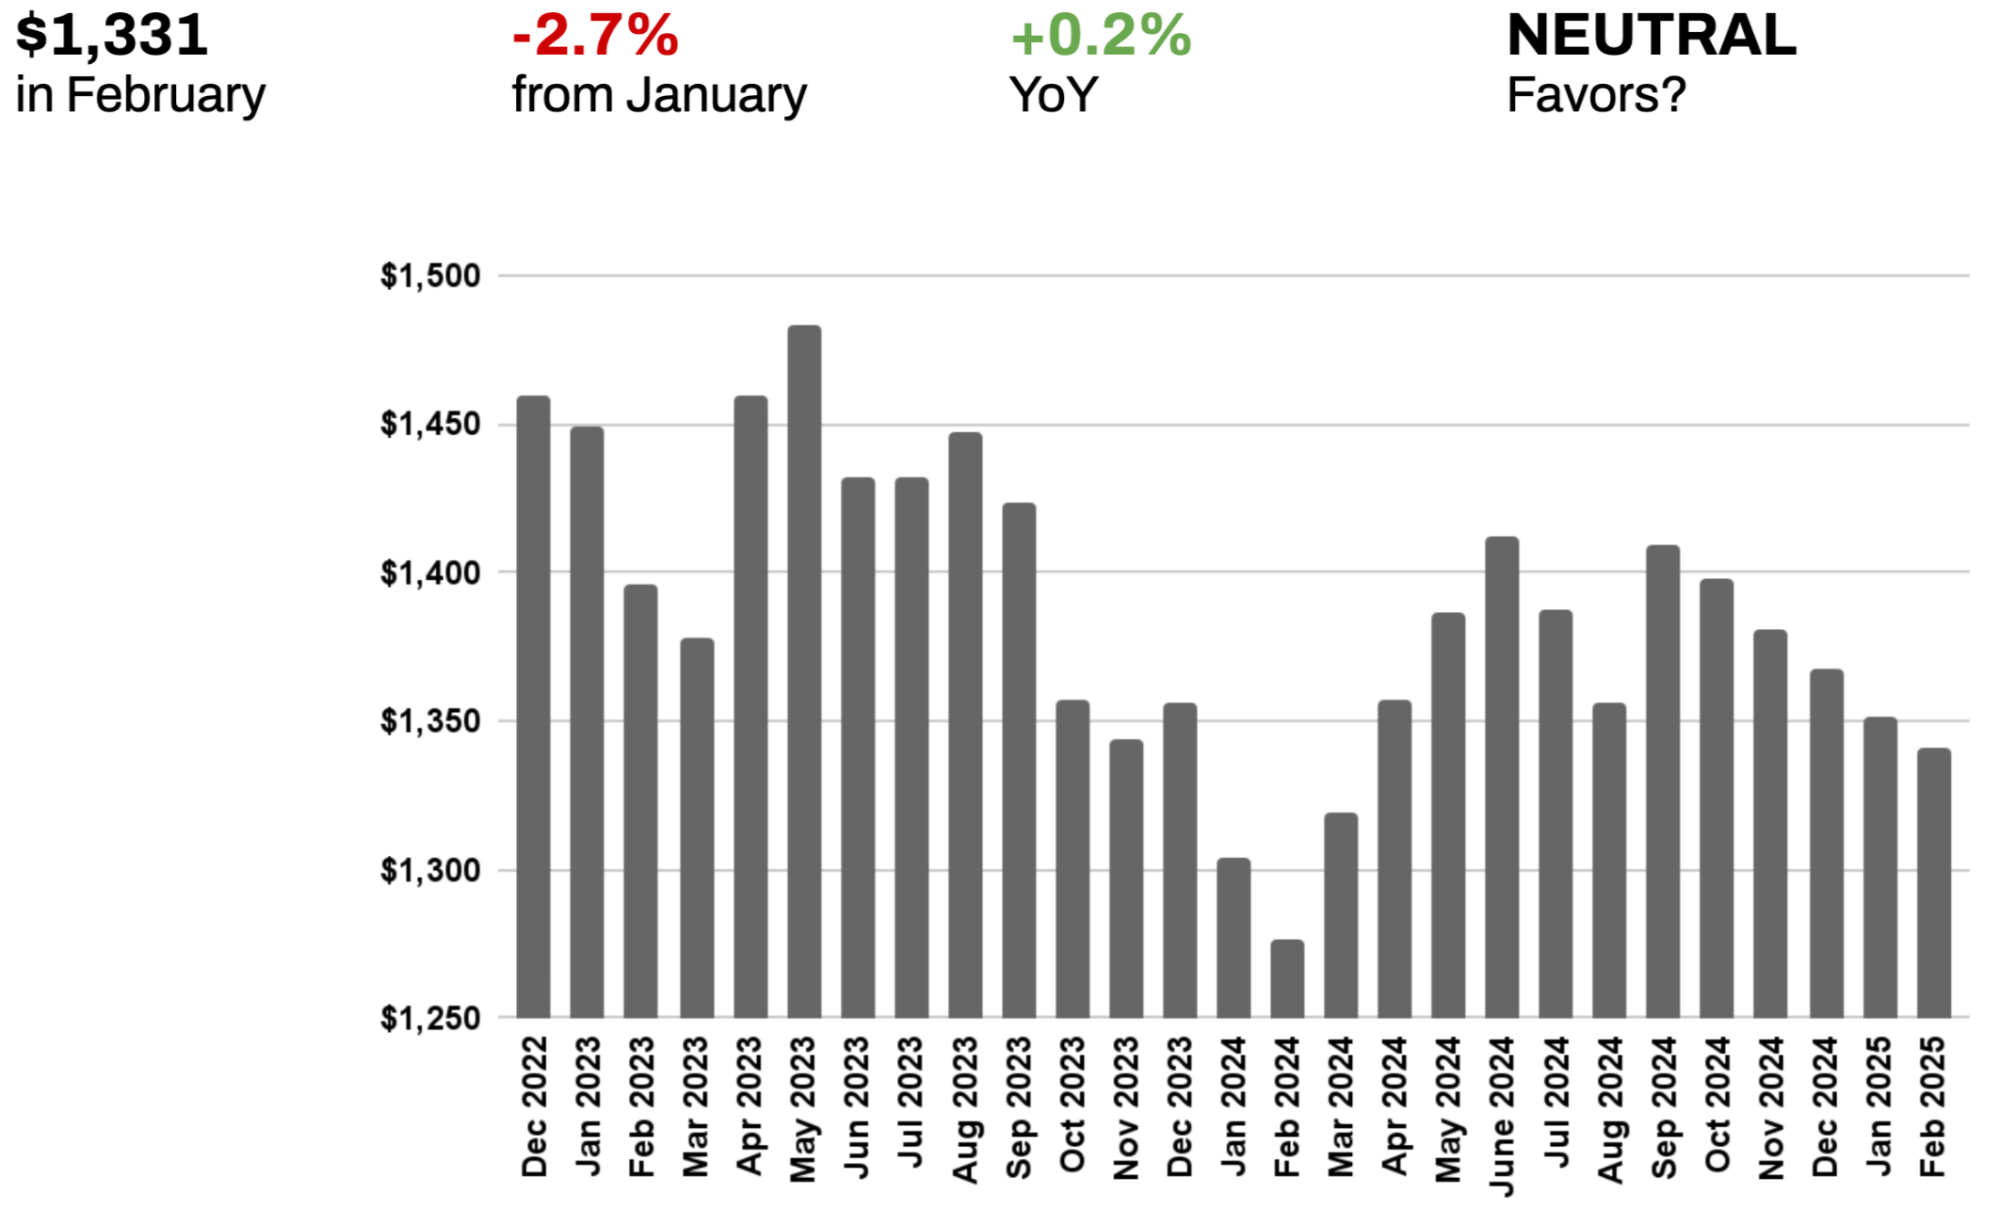
Rental Remarks
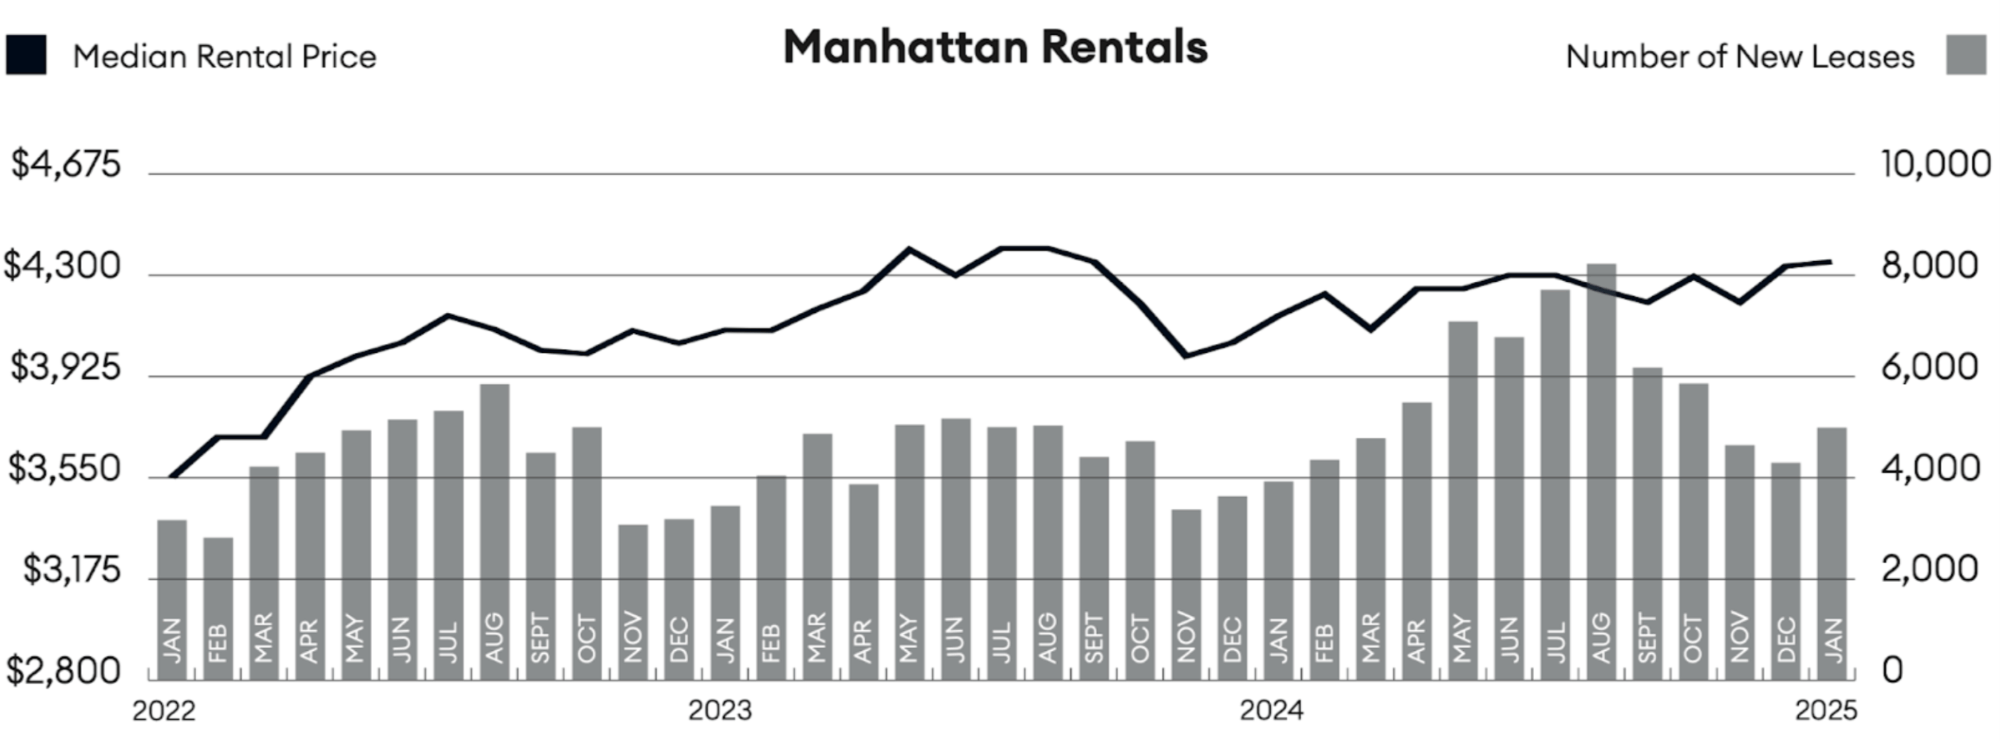
Chart courtesy of Miller Samuel, Inc.
In January 2025, the median rent in Manhattan rose by a slight 0.4% from the previous month, reaching $4,350. The year-over-year trend shows a much greater 4.8% rise in January 2025. Importantly, new lease signings increased annually for the tenth consecutive month, and the vacancy rate slipped year over year for the fourth time in five months.³
Mortgage Remarks
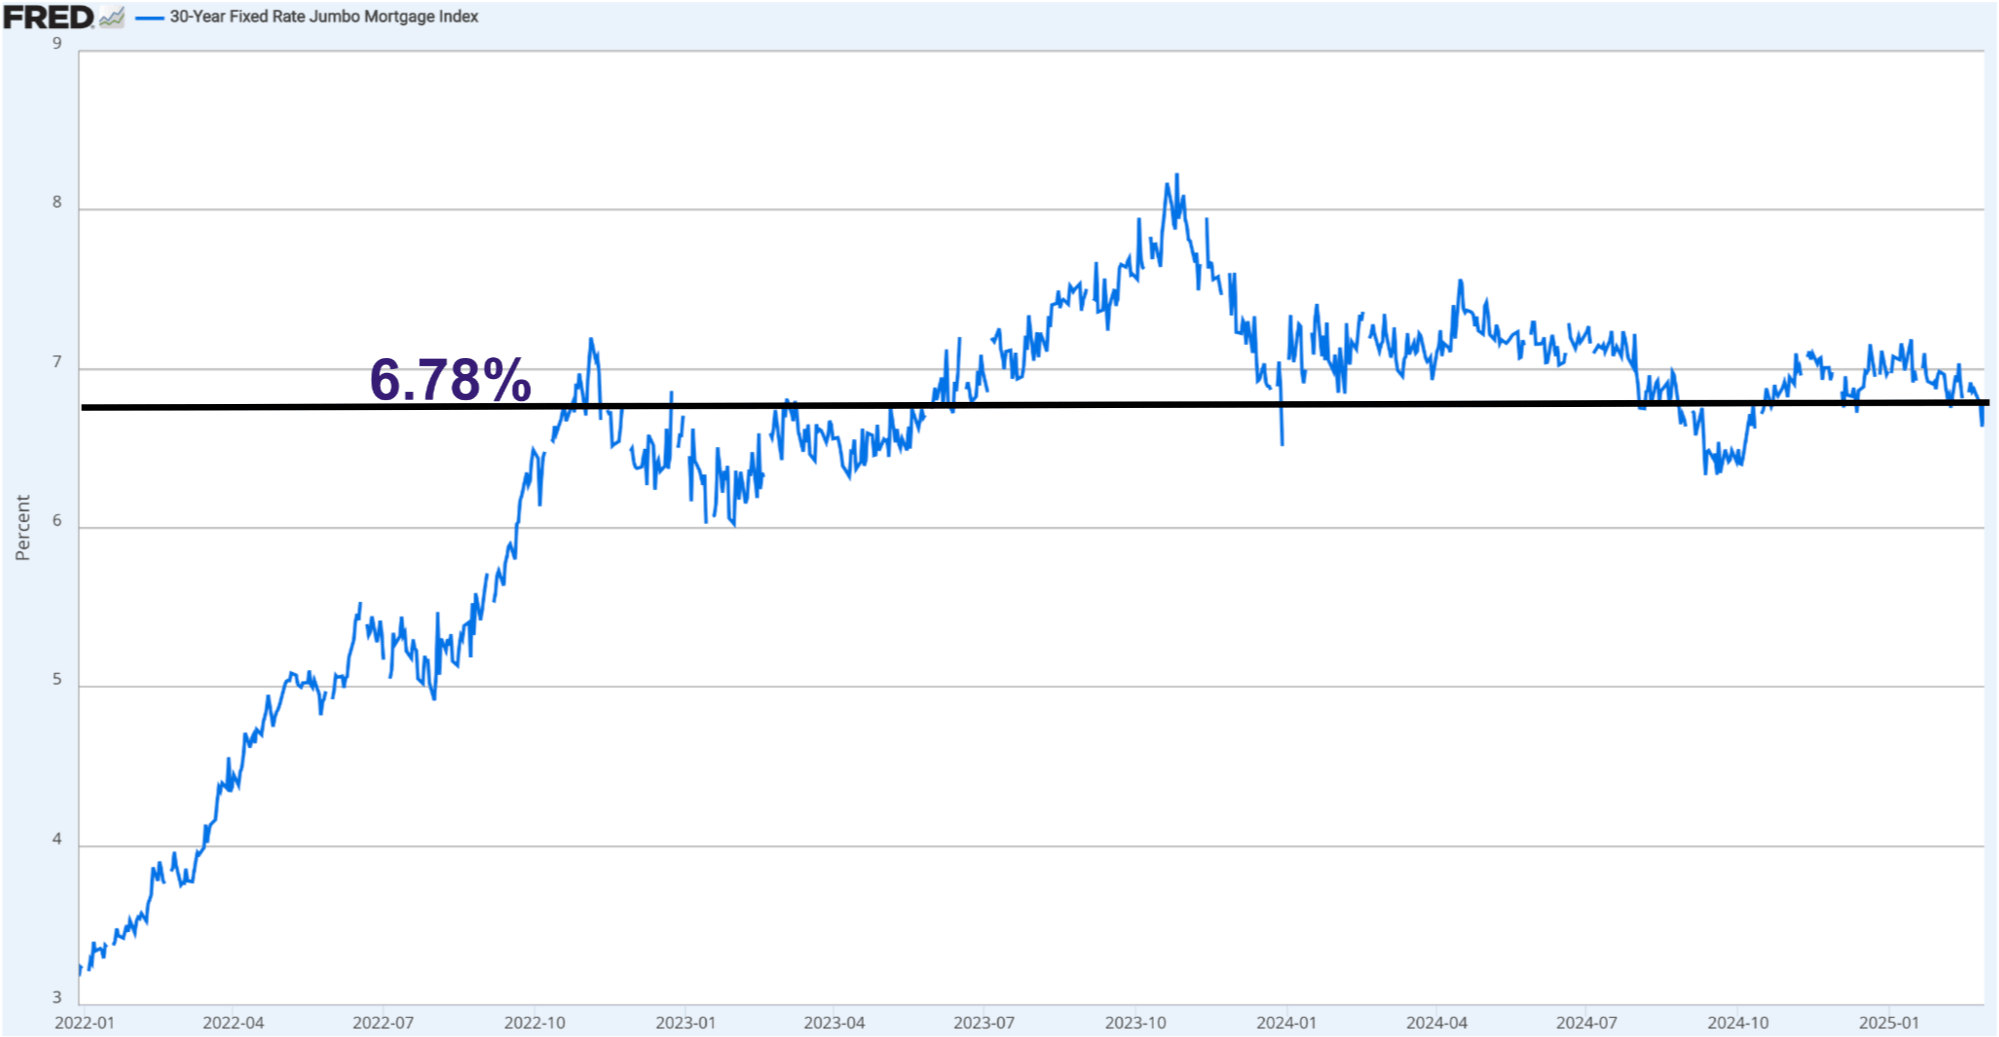
Courtesy of Federal Reserve Bank of St. Louis
The 30-Year Fixed Rate JUMBO Mortgage Index currently stands at 6.78%⁴, while the average JUMBO Annual Percentage Rate (APR) stands at 6.55%⁵. Although rates rose in the fall and into the winter of 2024, there has been a slight decrease recently. Additionally, in late January, the Federal Reserve chose to keep interest rates unchanged rather than lower them.
The broader expectation is that rates will remain in the 6.5% range through this year and into the next, reflecting a shift in sentiment that higher rates are here to stay for the foreseeable future.
However, interest rates are no longer the primary catalyst for market activity. Instead, buyers and sellers are adjusting to the new normal, making decisions based on personal needs and timelines rather than waiting for further rate drops. This shift signals a market driven more by necessity than speculation, reinforcing steady transaction volume despite elevated borrowing costs.
Investor Insights
The total return on real estate investments is driven by net rental income and capital appreciation. Manhattan cap rates are currently between 3% and 3.4% for all-cash investors. Unfortunately, investors using a large percentage of leverage face challenges in generating net income, given the average JUMBO mortgage APR of 6.55%. Timing and a strong USD may afford foreign investors, depending on their native currency, the opportunity to realize significant capital gains upon selling their assets.
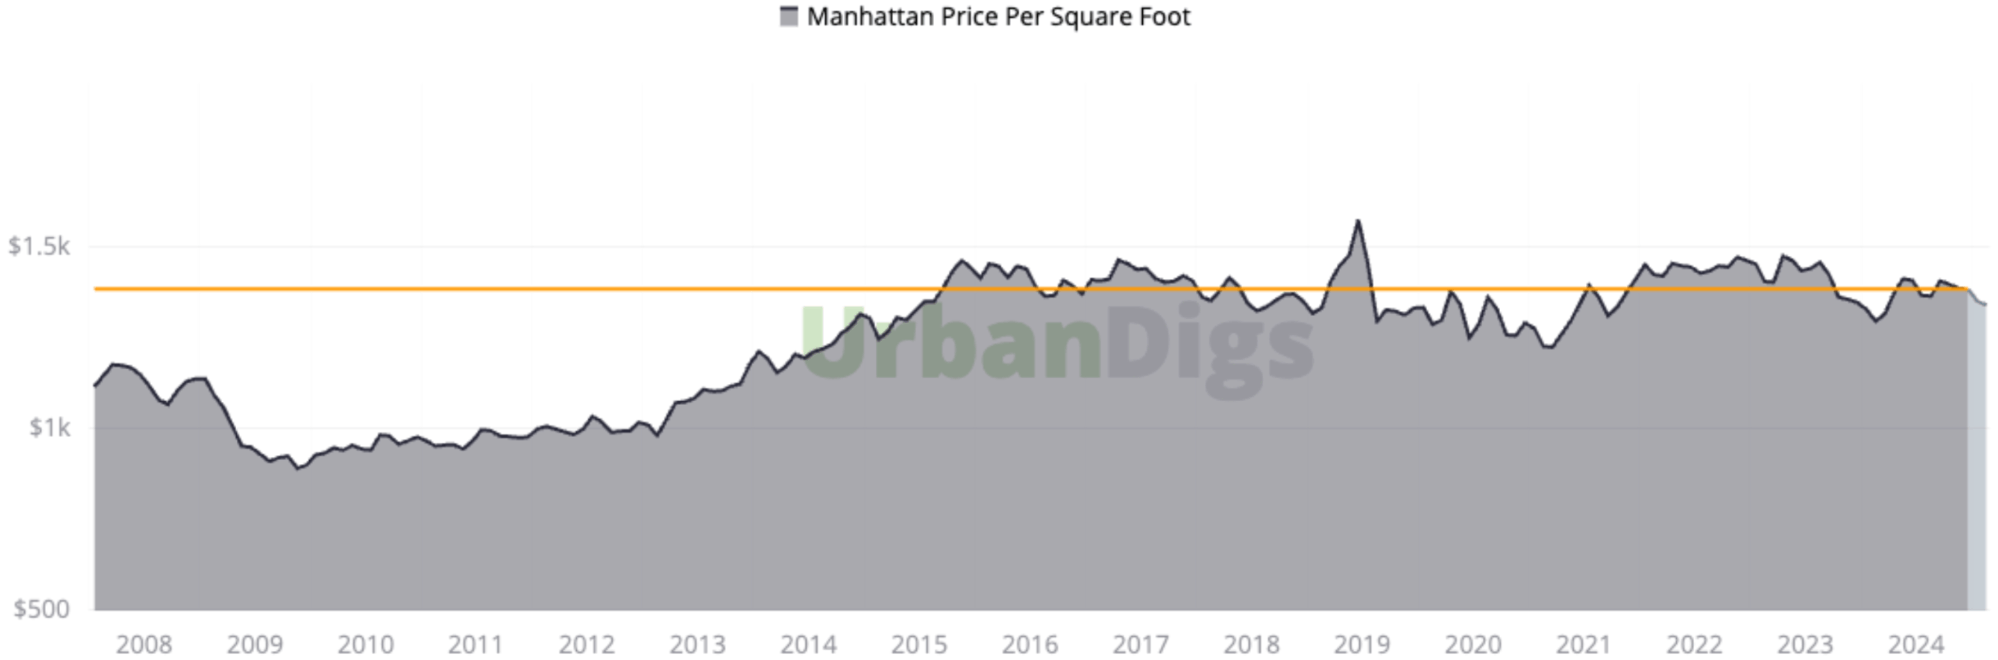
Chart courtesy of UrbanDigs and indicates Manhattan median PPSF as a function of the closed sale date. The light grey area to the extreme right indicates incomplete data, and the orange line indicates the most recent median PPSF based on data considered complete.
References
1. Data courtesy of UrbanDigs
2. According to the Elegran | Forbes Global Properties Brooklyn Leverage Index
3. Data courtesy of Miller Samuel, Inc.
4. Data courtesy of Federal Reserve Bank of St. Louis
5. JUMBO mortgage rate APR data courtesy of Bank of America, Chase, and Wells Fargo
If you would like to chat about the most recent market activity,
feel free to contact us at info@elegran.com or
connect with one of our Advisors.
About Us
Welcome to Elegran | Forbes Global Properties, where our mission is to revolutionize the world of real estate. Founded in 2008 by Michael Rossi, our journey began with an unwavering drive for motivation, innovation, and a genuine care for our clients.
As an independently owned brokerage, we pride ourselves on our elite team of "advisors," offering a personalized touch that goes above and beyond the traditional real estate experience. Armed with robust data insights, we empower our clients to make informed decisions that lead to success.
Distinguished as the exclusive member of the invitation-only Forbes Global Properties network in NYC, Elegran proudly stands at the forefront of excellence. This exclusive partnership broadens our horizons, enabling us to connect buyers, sellers, and investors with extraordinary luxury properties not only in New York City but across the globe.
Our passion lies in turning your real estate dreams into reality, and we are committed to providing exceptional service at every step of the journey.
Are you ready to experience the Elegran difference? Dive into the possibilities at www.elegran.com and embark on an unforgettable real estate adventure with us.
Recent Posts


Stay in the Know!
Sign up to receive our monthly newsletter

