
Elegran Manhattan Market Update: February 2024

Overall Manhattan Market Update: February 2024
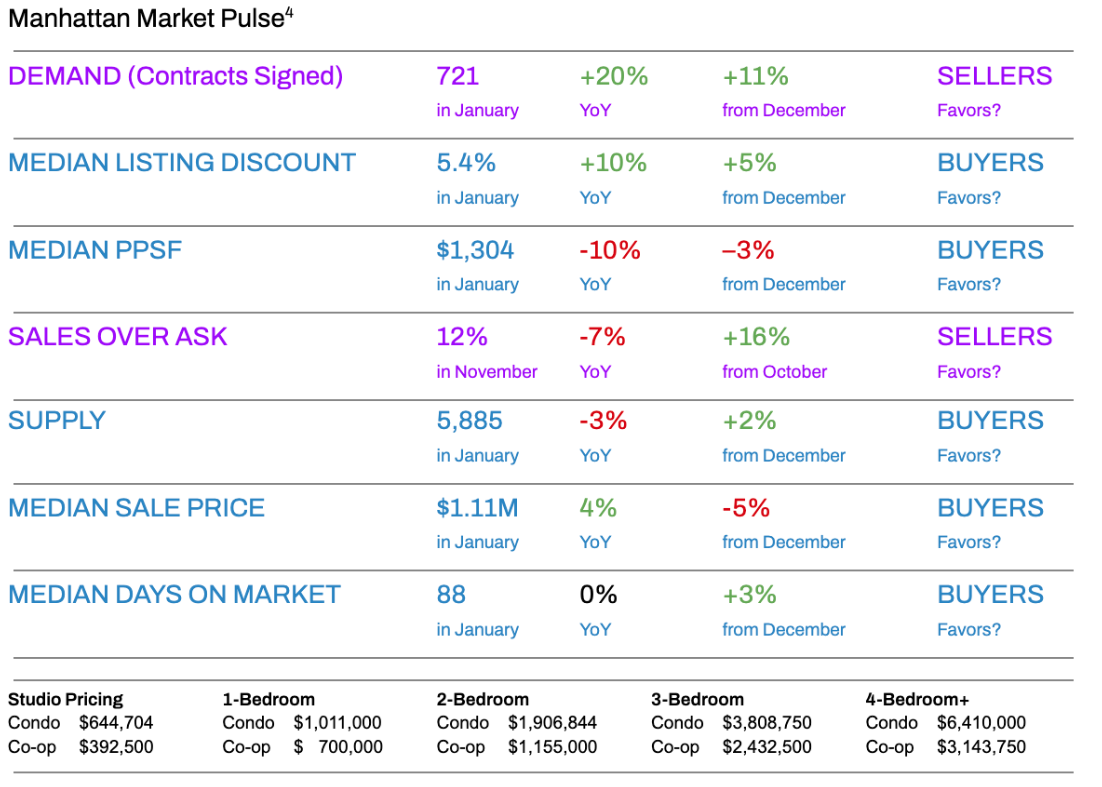
FEBRUARY MANHATTAN MARKET UPDATE: Demand is on the Rise
The Manhattan real estate market kicked off 2024 with a strong start. January witnessed an 11% surge in the number of contracts signed compared to December, along with an impressive 20% year-over-year increase. While supply typically sees a seasonal uptick in January, it has risen by 2% compared to December but remains 3% lower than last year.
One significant driver behind this upswing is declining mortgage interest rates, which have enticed more buyers to [re]enter the market. With this promising start, 2024 is shaping up to be a year of increased contract activity in Manhattan.
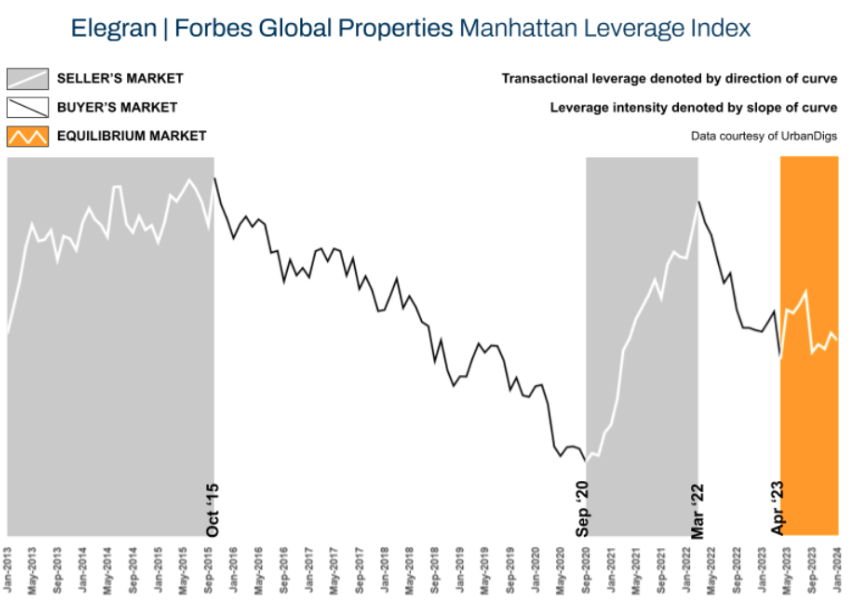
According to the Elegran | Forbes Global Properties Manhattan Leverage Index, buyers gained some leverage last month. Still, that increased leverage may be short-lived as the market picks up steam heading into the spring.
SALES
“Neutral” markets don’t exist because buyers and sellers are constantly playing tug-of-war for leverage. At times (e.g., the past 9 months), there’s no clear winner as buyers & sellers reach equilibrium.¹
- Based on the data, buyers gained a small advantage this month.
- Demand (measured by contracts signed) increased in the seller’s favor.
- Median PPSF (Price Per Square Foot) decreased in the buyer’s favor.
- Supply increased in the buyer’s favor.
- Median Days on the Market increased in the buyer’s favor.
RENTALS
- From the all-time high of $4,300 in May & July, the median rental price has retreated to $4,000.
- Rents have retreated from recent all-time highs, and the rental market is experiencing a seasonal softening, with rental asking prices decreasing slightly and some apartments offering concessions.
- The rent versus buy scale may feel equally punitive on both sides, with rents still near all-time highs and mortgage rates near their decades-long high as well.²
INVESTMENTS
The total return is generated by net rental income & price appreciation.
- All-cash buyers can expect a cap rate between 2.7% - 3.2%.
- Since the average JUMBO mortgage rate APR is 6.36%³, there is no net rental income on leveraged purchases.
Elegran | Forbes Global Properties Manhattan Leverage Index
The Elegran | Forbes Global Properties Manhattan Leverage Index is powered by four indicators: supply, demand, median price per square foot (PPSF), and median listing discount.
It informs us whether the current is a buyer’s or a seller’s market, i.e., which party possesses transactional leverage. Looking at the graph below, this is indicated by the direction of the curve, where:
- An increasing trend from left to right indicates a seller’s market
- A decreasing trend from left to right indicates a buyer’s market
Our indicator also informs us regarding the relative strength of that leverage, indicated by the slope of the curve, where:
- A gentle slope indicates a weak advantage by one party over the other
- A sharp slope indicates a strong advantage
But the numbers are not important. What is important is the direction and slope of the curve. For the last few months, it’s been a stalemate between buyers and sellers with a relatively balanced market. In the last month, buyers gained a slight advantage. In the coming months, look for leverage to shift back towards sellers as demand accelerates and supply constricts compared to the prior year.
Manhattan Supply
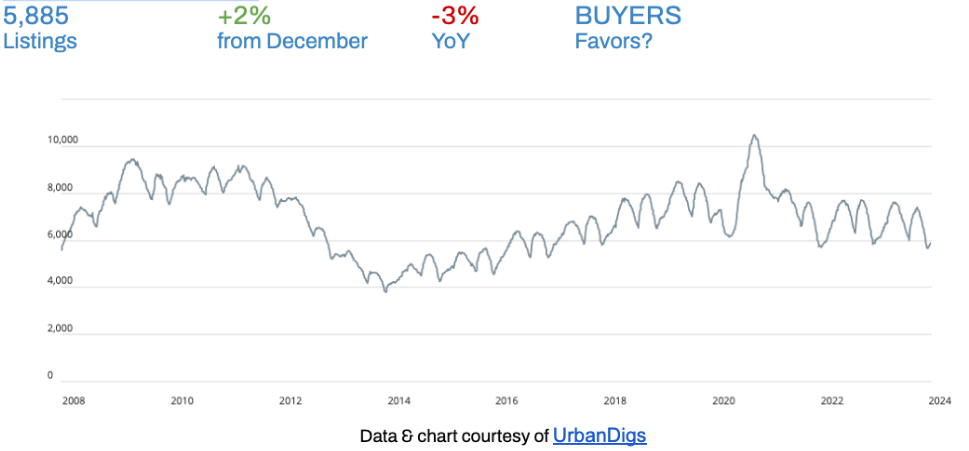
Manhattan supply has followed a similar cadence - pandemic excluded - for the past decade, as the chart above clarifies. Supply increased slightly in January compared to December, tracking seasonal trends.
What this means for:
- BUYERS: When supply increases, there's more inventory to choose from. Supply is increasing as the spring season approaches, but supply is lower than last year's period.
- SELLERS: The more inventory on the market, the more competition a seller faces. As supply increases heading into the spring, sellers will face increasing competition.
Anticipate a rise in supply during February, providing buyers with more options while increasing seller competition.
Manhattan Demand
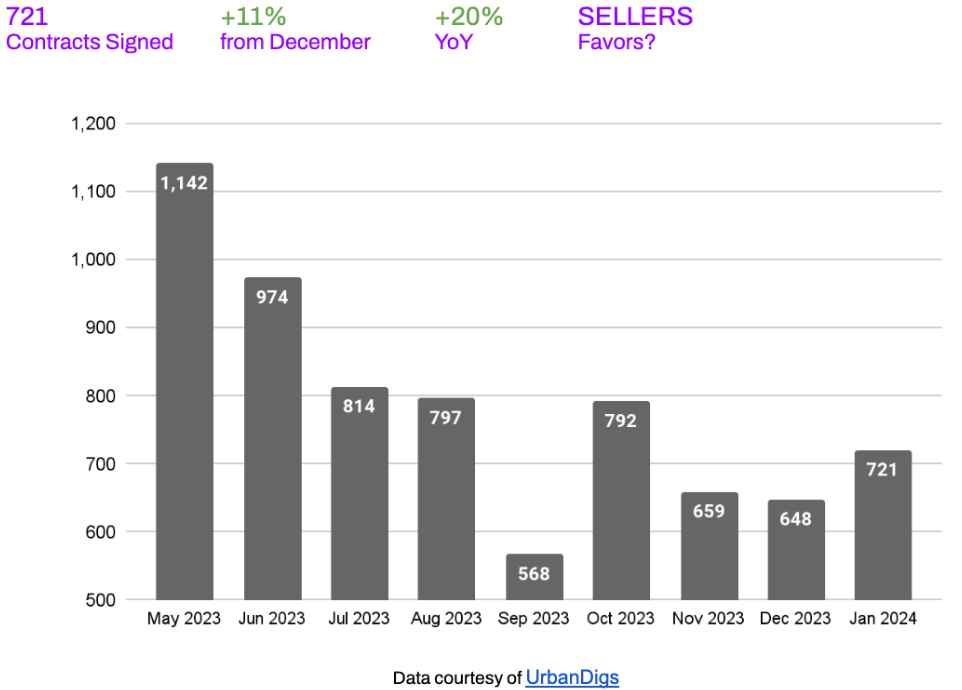
After a decrease in December 2023, demand, measured by contracts signed, bounced back and increased in January 2024. Contract activity was 20% higher in January 2024 than in January 2023, in large part because declining mortgage interest rates pulled some buyers off the sidelines.
What this means for:
- BUYERS: More competition.
- SELLERS: More activity.
Anticipate a continued upswing in contract activity over the coming months, as spring is traditionally the peak season for Manhattan’s real estate market.
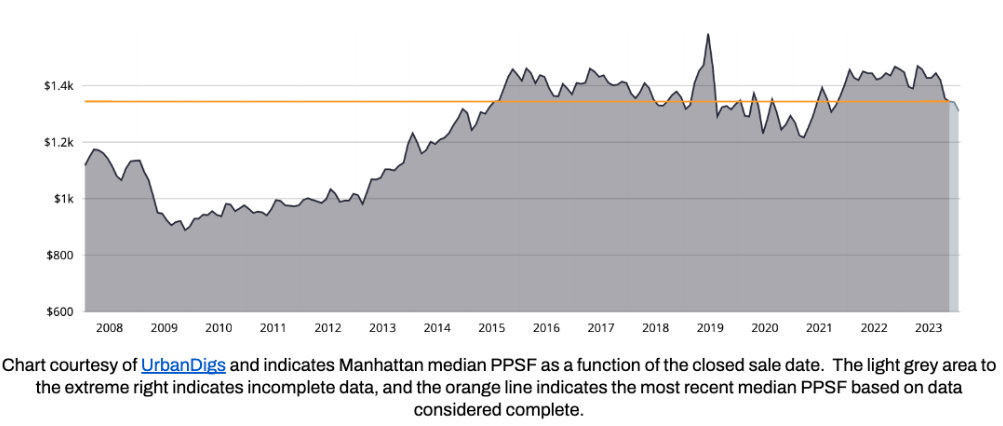
Manhattan Median PPSF

The median PPSF is at the lowest point in the past 12 months and down 12% from May’s 2023 high.
What this means for:
- BUYERS: Prices are moving in their favor.
- SELLERS: Prices are moving against their interests.
Manhattan Median Listing Discount
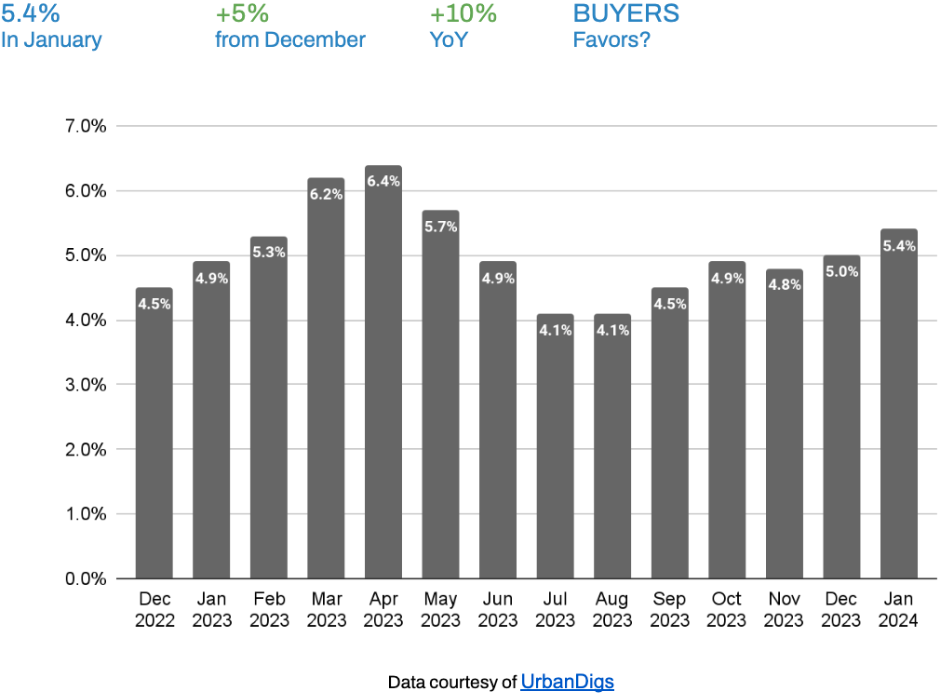
The median listing discount in January has increased compared to December, indicating a shift in favor of buyers.
What this means for:
- BUYERS: There was an increase in January, which is favorable for buyers, who have more negotiating power today than last year.
- SELLERS: Sellers need to be prepared to offer buyers larger discounts today or adjust their asking prices to reflect the current market dynamics.
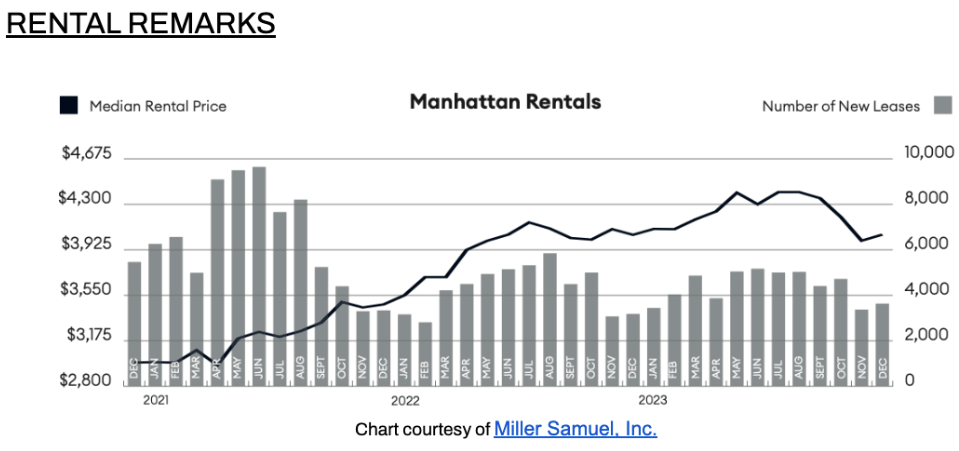
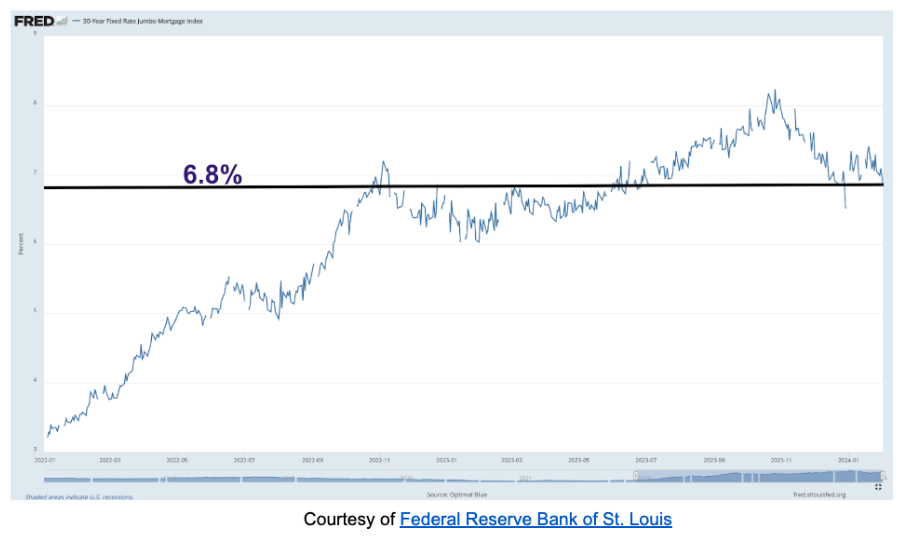
In December⁵, the median rent in Manhattan increased slightly and remained near record highs. The 30-Year Fixed Rate JUMBO Mortgage Index⁶ is trending at 6.8%, and the average JUMBO APR is 6.36%⁷. So, it’s a “catch-22” for renters, as the rent versus buy scale may feel equally punitive on both sides.
INVESTOR INSIGHTS
The total return is driven by net rental income and capital appreciation. For all-cash investors, Manhattan cap rates are currently 2.7 - 3.2%. Unfortunately, there is no net income potential for those investors using a large percentage of leverage, with the average JUMBO mortgage APR at 6.36%. Timing and a strong USD may afford foreign investors, depending on their native currency, the opportunity to realize significant capital gains upon selling their assets.
References
1. According to the Elegran | Forbes Global Properties Brooklyn Leverage Index
2. Data courtesy of Miller Samuel, Inc.
3. Mortgage data courtesy of fred.stlouisfed.org
4. Data courtesy of UrbanDigs
5. January 2023 data is not yet available
6. Data courtesy of Federal Reserve Bank of St. Louis
7. JUMBO mortgage rate APR data courtesy of Bank of America, Chase, and Wells Fargo
If you would like to chat about the most recent market activity, feel free to contact us at info@elegran.com or connect with one of our Advisors.
About Us
Welcome to Elegran | Forbes Global Properties, where our mission is to revolutionize the world of real estate. Founded in 2008 by Michael Rossi, our journey began with an unwavering drive for motivation, innovation, and a genuine care for our clients.
As an independently owned brokerage, we pride ourselves on our elite team of "advisors," offering a personalized touch that goes above and beyond the traditional real estate experience. Armed with robust data insights, we empower our clients to make informed decisions that lead to success.
Distinguished as the exclusive member of the invitation-only Forbes Global Properties network in NYC, Elegran proudly stands at the forefront of excellence. This exclusive partnership broadens our horizons, enabling us to connect buyers, sellers, and investors with extraordinary luxury properties not only in New York City but across the globe.
Our passion lies in turning your real estate dreams into reality, and we are committed to providing exceptional service at every step of the journey.
Are you ready to experience the Elegran difference? Dive into the possibilities at www.elegran.com and embark on an unforgettable real estate adventure with us.
Recent Posts


Stay in the Know!
Sign up to receive our monthly newsletter

